Stop Chasing Better Prompts. Build a Reporting Pipeline Instead.

In this article:
In almost every team, 20–30% of the workday goes toward describing and explaining things that have already been done. Everyone talks about AI agents that “produce” things. But the fastest way to strip routine work from your team is sitting right there, largely undiscussed — reporting automation.
This is where AI delivers instant ROI. Let me walk through what we’ve already built at Projector, then lay out the principles that can help you build something similar for your own product or team.
What we’ve already automated at Projector
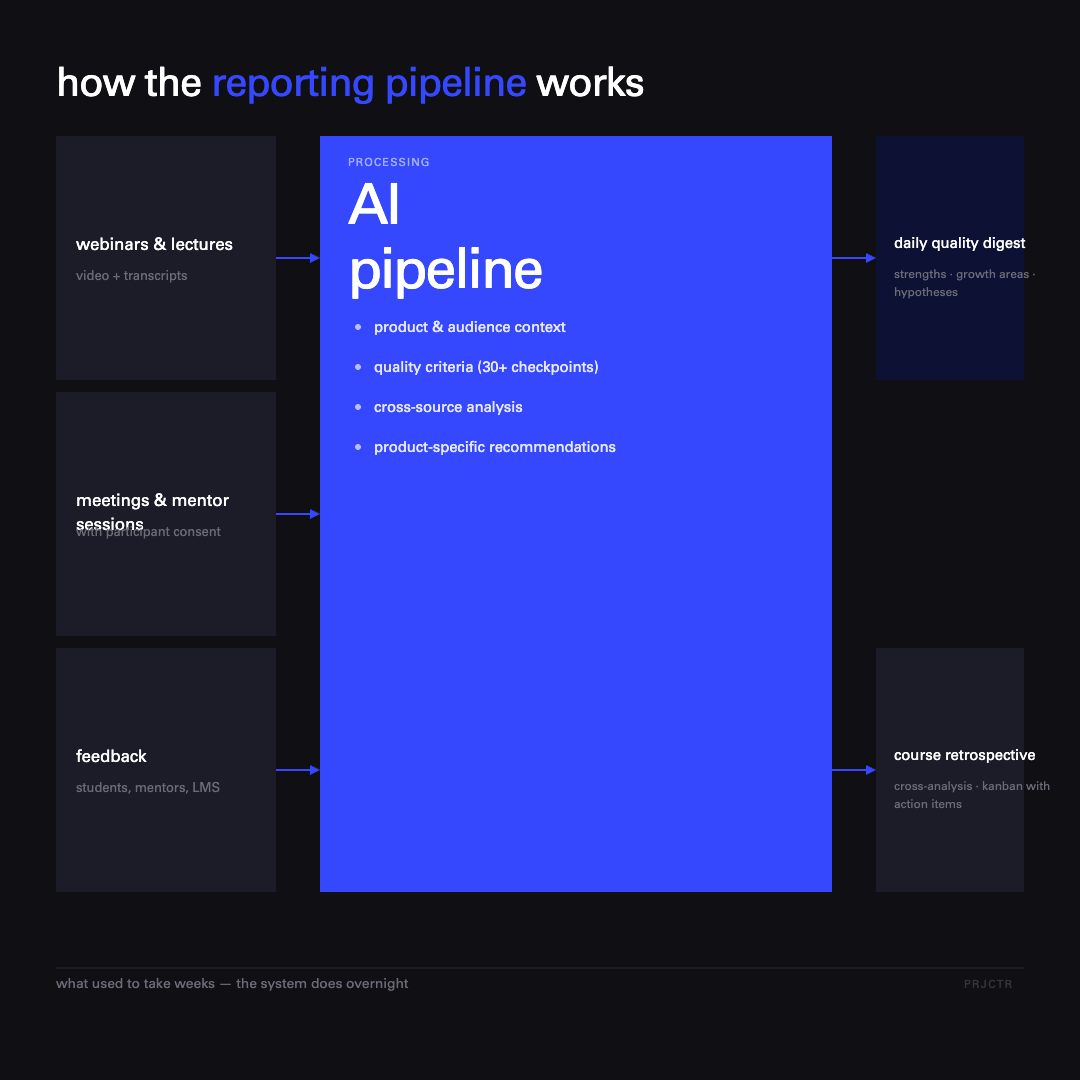
All of Projector’s reporting now runs on automated pipelines. Recorded lessons, live webinars, introductory sessions, career webinars, and mentorship sessions (with participant consent) all flow through a single processing pipeline. We’re not just dumping content into a database — the system extracts useful signals from it immediately.
On top of that foundation, we’ve built two reports the team reads most often.
The daily webinar quality digest
Every day, the team receives a report with clear quality criteria tailored to each content type. It surfaces strengths and ideas worth scaling, areas that need improvement, and both short- and long-term hypotheses about what to actually do about them next week.
The key ingredient is context. Before the analysis runs, the system pulls in data about our program, the learning stage, the audience, and the specific course. Without that, AI gives you generic advice at the level of “let’s do better.” With context, it returns recommendations that are specific to the product. MIT Sloan research confirms this: nearly half of the performance gains from a better AI model come not from the model itself, but from how users adapt their prompts — which is really just another way of saying that context is everything.
The automated course retrospective
This is our most complex pipeline. And our most useful. It pulls metrics from a wide range of sources:
- mid-course and final student feedback
- product and financial metrics for the course
- instructor feedback on their experience working with us
- LMS data: how instructors give feedback on the platform and how students rate individual lessons
- behavioral patterns that signal issues in the curriculum or workshop
- aggregated reports across all webinars in a cohort
The output is a retrospective with cross-analysis and a kanban board of concrete action items. What used to take the team weeks to compile by hand now happens overnight. The instructor, manager, and producer show up to the wrap-up meeting with a full picture already in front of them — and hypotheses ready to discuss.
Marketing reports, course dashboards, and sales call analysis all follow the same logic. The principles below are what we distilled from building all of it.
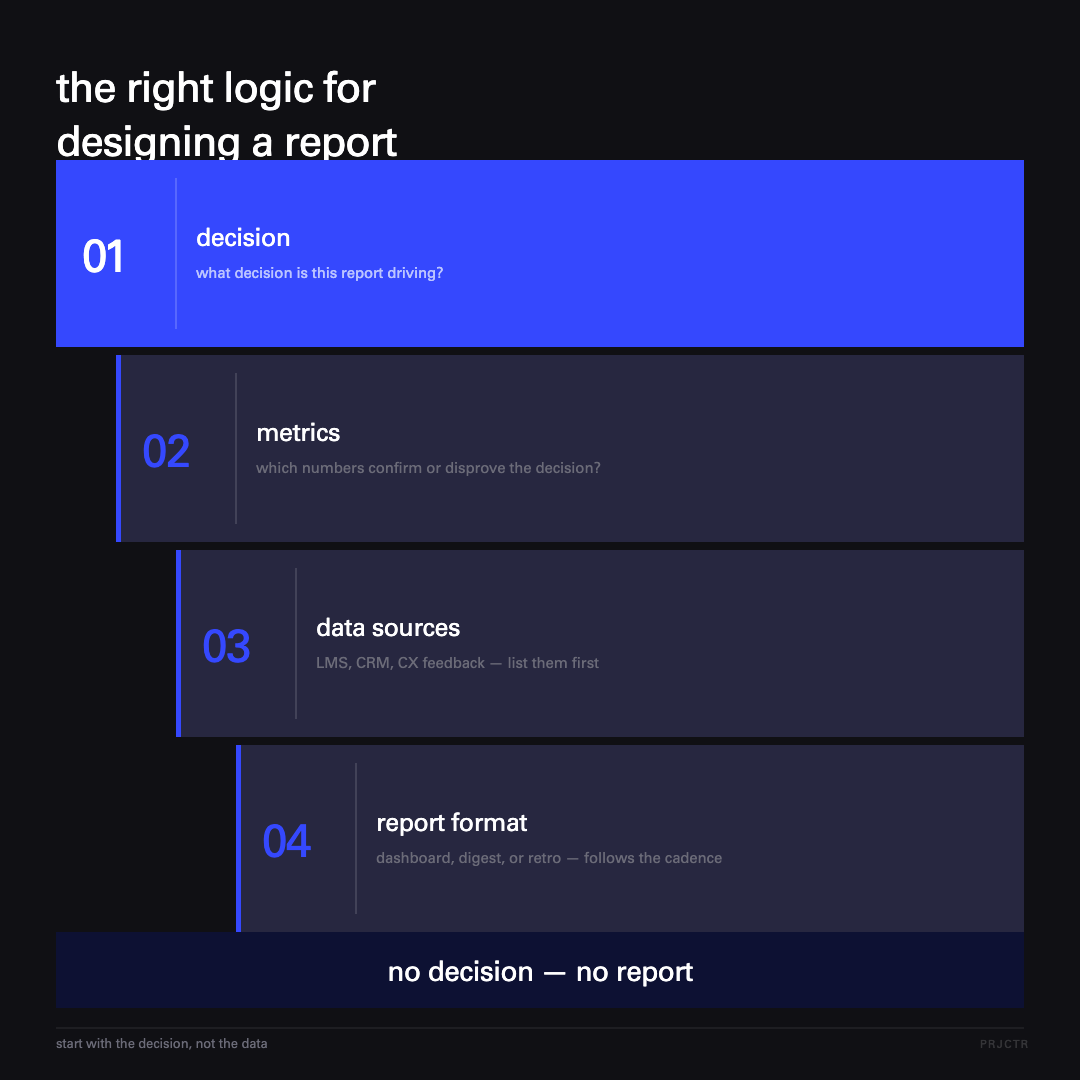
Every report starts with a decision
Before you automate anything, ask yourself one question: what decision does this report actually drive? No answer — no report, no matter how long it’s been running. I’ve distilled our experience into seven principles. The first three are about designing a pipeline worth building in the first place.
Start with the decision. Most “corporate reports” are descriptive reporting for its own sake. Automating them just scales the busywork. The logic needs to run in reverse: decision → metrics → data sources → report format. That order, and only that order.
Define your quality criteria explicitly. An AI report is only as good as how clearly you’ve defined what “good” and “bad” actually mean. Our webinar quality rubric has over 30 specific criteria — from intro structure to how the speaker handles questions. A useful test: write the rubric for a person first. If a new team member can score an event the same way a seasoned colleague would, the rubric is ready for AI. If their scores diverge — AI will flounder too.
Build modularly. One big “magic report” is an antipattern that breaks at the first change. Build small, composable blocks instead. The webinar report is its own module. The student feedback report is its own module. The course retrospective is a composition of those modules plus a cross-analysis layer on top. When you need a new report format tomorrow, you’ll assemble it from the same building blocks in a day. Not a month.
Context and cross-analysis do the heavy lifting
A report becomes a real tool when the system pulls in context automatically and adds a cross-analysis layer. Without that, it’s just a file someone opens once and forgets. The next two principles are entirely about this.
Pull context automatically. This is the difference between a dry AI report you could throw away and one the whole team debates in a meeting. AI without context gives you template advice. The same AI fed context about the product, the audience, and the team’s previous decisions returns insights at the level of a sharp junior analyst. Always pull in detailed product information, target audience data, funnel stage, prior decisions, and business goals. McKinsey’s annual State of AI research shows that organizations that embed AI into their actual workflows — rather than running it as a standalone layer — consistently outperform those that don’t. The mechanism is exactly this: structured context driving decisions.
Add a cross-analysis layer. This is the most valuable — and most underrated — layer in the whole system.
“A single report shows facts. Cross-analysis shows patterns no human can hold in their head at once.”
Nobody has the bandwidth to track 20+ data sources simultaneously. One bad webinar is a fluke. A bad webinar combined with student drop-off the following week and an unusual instructor review — that’s a signal to redesign the module. This is exactly the layer where AI does work that humans physically can’t keep up with.
Without discipline, the system becomes decoration
A report without concrete next steps is noise. A pipeline nobody measures is decoration. The last two principles keep the system alive.
End every report with specific actions. Without this step, the team gets beautiful dashboards and does nothing with them. It’s the classic “reporting theater” trap: the report gets made, someone reads it, and that’s that. Every report needs to close with a list of action items that someone picks up immediately. Build that into the team process as a hard trigger — a defined moment where the report gets reviewed and recommendations get acted on. McKinsey puts it well: when meetings are run well, they not only produce better decisions but leave people energized to carry the momentum forward independently — and the same principle applies to any report that functions as a pre-meeting brief.
Measure the pipeline itself. Automation needs to be under metrics too. How many hours per week did it free up — count before and after. How many of the action items from automated reports actually got done. Did those reports actually drive real team decisions. And how often does the system fire off alerts for no real reason — that’s your false positive rate. If none of these metrics improve, it’s decoration. Best-practice AI reporting workflows track exactly these indicators: time saved, error reduction, and whether automated outputs actually change team behavior.
What to avoid
The biggest mistakes in reporting automation are strategic, not technical. Here are the four most common.
- Automating everything at once. Start with whatever hurts most and repeats most often. One strong pipeline beats five mediocre ones.
- Blindly trusting AI on high-stakes decisions. Anything that affects a student, money, or reputation needs a human in the loop. Everything else can run on autopilot. HBR’s research on structured AI use in organizations makes the same point: the teams that get the most from AI are the ones that invest in governance and testing discipline, not just the tools themselves.
- Building reports nobody asked for. Check whether the stakeholder will actually open this dashboard every week. If not — don’t build it.
- Skimping on prompts and versioning. A prompt is a product. It needs to be versioned and tested like code.
What all four have in common is the temptation to do more than the team actually needs. The best pipeline solves one real problem. Everything else is just looking busy.
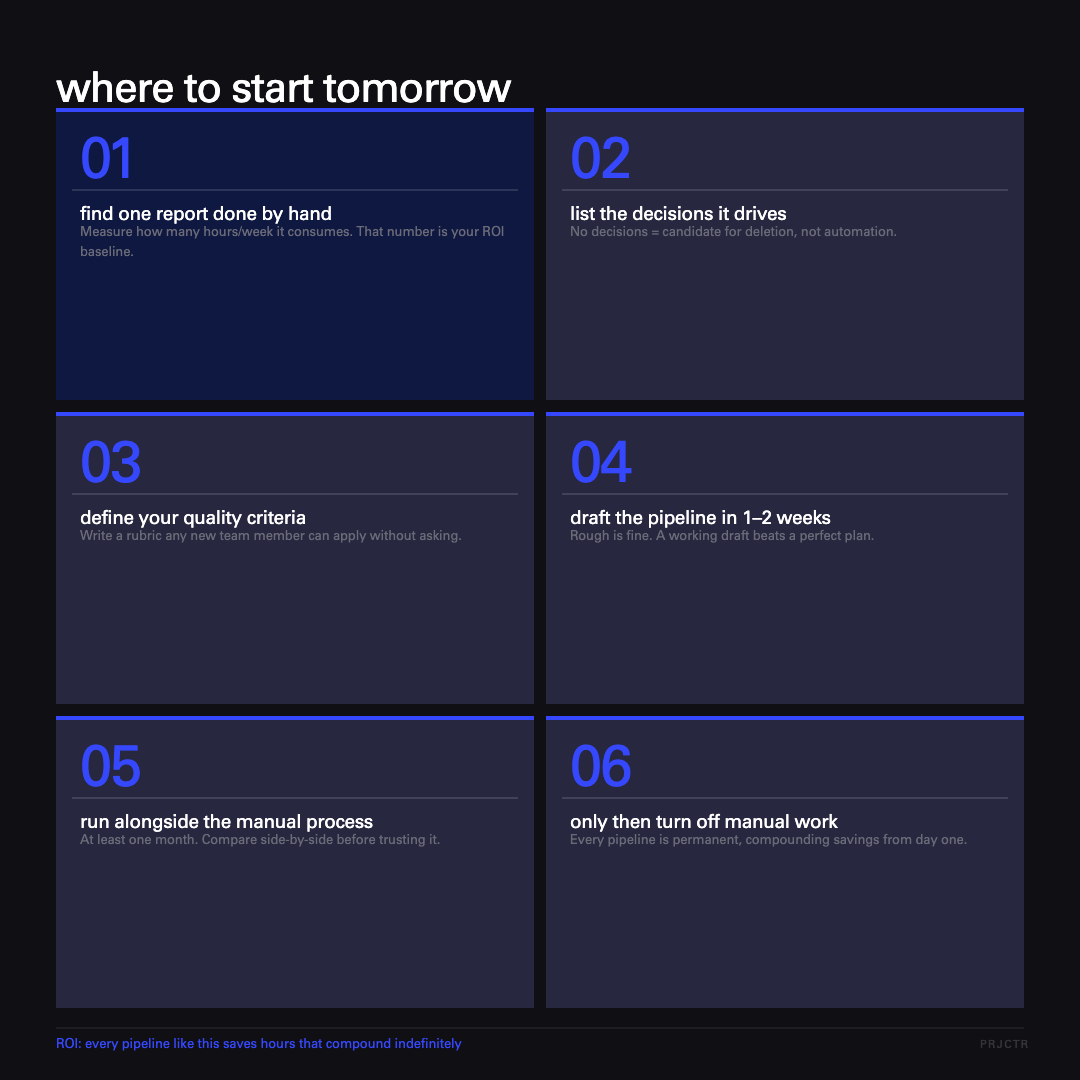
Where to start tomorrow
Start with one report your team already produces by hand. Here’s the minimum viable path.
- Find one recurring report that gets done manually. Measure how many hours a week it costs.
- List the decisions that are actually made based on it. No decisions — it’s a candidate for deletion.
- Write out the quality criteria and metrics as a rubric a new team member could follow.
- Build the first rough version of the pipeline in 1–2 weeks. Don’t try to make it perfect.
- Run it in parallel with the manual process for at least a month and compare results.
- Only then shut down the manual version.
This isn’t a one-week project. But each pipeline you ship is a permanent time saving that compounds indefinitely. McKinsey’s latest productivity research finds that the companies capturing the most value from AI are redesigning entire workflows around it, not bolting it onto existing processes — which is exactly what reporting pipelines force you to do. And if you want to nail down which metrics to track as you scale, the same principle applies: measure what drives decisions, not everything you can.
grow your careerwith real-world knowledge
automated reportingfrequently asked questions
- What is automated reporting and how does it differ from a regular dashboard?
- How do you start automating team reporting without overengineering it?
- What makes an AI-powered report actually useful vs. just noise?
- What are the most common mistakes in business process automation for reporting?
more interesting articlesfor you
